Chapter 4: McKinsey, BCG, Deloitte — Manufacturing Physical AI Outlook and ROI Analysis
4.1 How to Read Consulting Data — Between Optimism and Reality
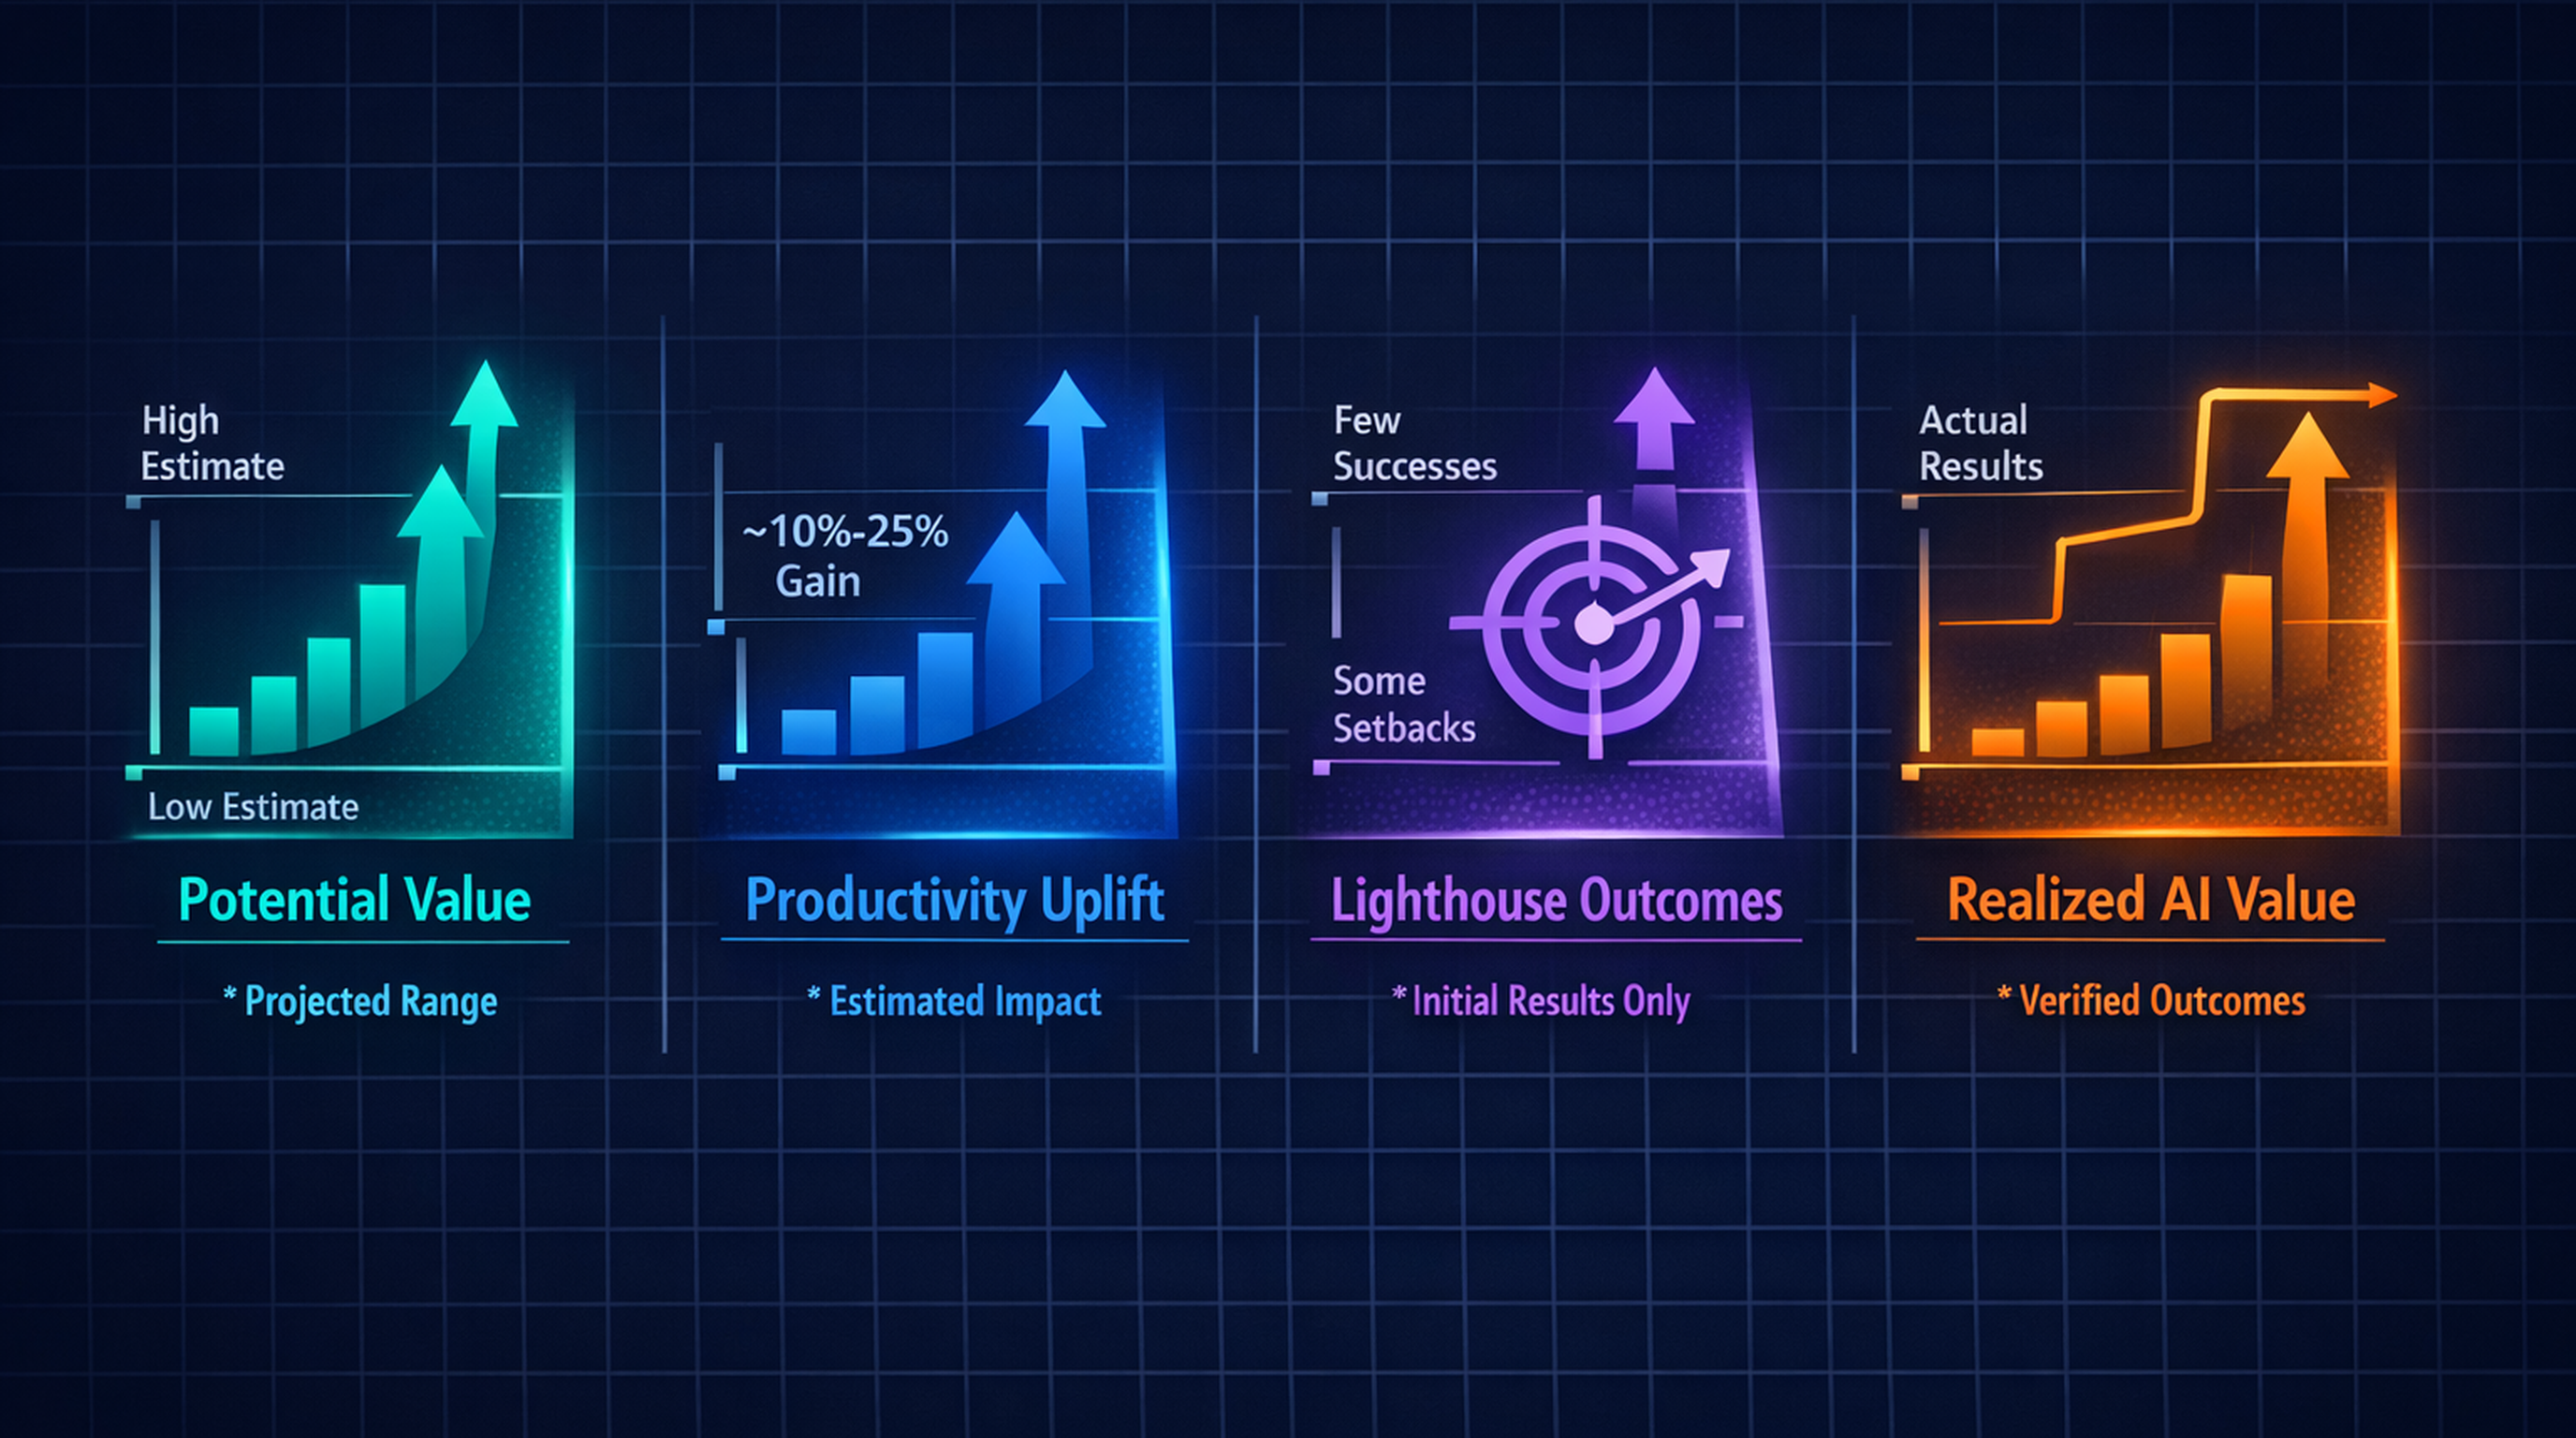
The first difficulty an executive faces when evaluating Physical AI investment is that the numbers are too many and too large. McKinsey forecasts that GenAI alone will generate $2.6T-$4.4T in annual economic value [1]; BCG argues that an end-to-end AI approach can deliver more than 30% productivity gains [6]; and PwC predicts that by 2030 the share of industrial manufacturers that have highly automated their core processes will more than double from 18% to 50% [12]. These figures are attractive to cite in board materials, but taking them at face value invites two traps.
The first trap is conflating "potential" with "reality." McKinsey's $2.6T is the upper bound of "what would happen if all 63 use cases were successfully deployed" [1], and BCG's 30% productivity gain is the average for "companies that completed an end-to-end transformation" — not the industry average [6]. According to a BCG global survey of 1,800 manufacturing executives, 89% are planning AI adoption and 68% have started, but only 16% have actually achieved their AI goals [4]. The potential value is enormous, yet the path to realizing it is narrow.
The second trap is the incentive structure of consulting reports. McKinsey, BCG, and Deloitte are all firms that consult on AI adoption, so their reports tend to converge on the conclusion "if you don't do AI, you fall behind." Case studies cluster around lighthouse factories and early adopters, which introduces cherry-pick bias; even when averages are reported, they rely heavily on self-reported surveys.
Yet consulting data cannot be ignored, for one clear reason. These reports shape the decision frame of executives at the world's top 1,000 manufacturers. The digital-transformation KPIs of COSMAX's global customers — L'Oréal, P&G, Shiseido — derive directly from the numbers in these reports. For COSMAX, as an ODM, to meet their expectations, COSMAX must be able to measure and explain itself within the same frame.
This chapter critically organizes the 2024-2026 flagship reports of four consultancies (McKinsey, BCG, Deloitte, PwC). Each section follows a three-step structure: "what they claim → under which conditions it is valid → how to interpret it at COSMAX scale." The final section (4.5) lays out a realistic starting point for a cosmetics ODM.
4.2 McKinsey — Economic Potential and the Lighthouse Network
Anatomy of the $2.6T-$4.4T Number
In June 2023, the McKinsey Global Institute (MGI) published The Economic Potential of Generative AI, estimating that GenAI alone could create $2.6T-$4.4T in annual economic value [1]. The figure was derived from analyzing 63 use cases across 16 business functions, 850 jobs, 2,100 detailed work activities, and 47 countries (more than 80% of the global labor force). For comparison, the UK's 2021 GDP was $3.1T — that is the order of magnitude.
This estimate, however, must not be applied directly to manufacturing. The same report states explicitly that 75% of GenAI's value is concentrated in four areas: customer operations, marketing & sales, software engineering, and R&D [1]. In other words, the primary beneficiaries of GenAI in manufacturing are the white-collar functions of R&D, design, and customer engagement — not the production line itself. From the perspective of a cosmetics ODM, value creation in "formulation development, technical sales, customer-tailored proposals" is likely to materialize before "factory line automation."
Furthermore, the $2.6T-$4.4T is an incremental 15-40% added on top of the $11T-$17.7T value already attributed to non-GenAI analytical AI [1]. That is, the potential value of "AI as a whole" is in the $13.6T-$22.1T range, of which the GenAI increment is $2.6T-$4.4T. Executives reading summary articles often conflate these two numbers.
153 Lighthouse Factories — What Is Different
The most credible dataset McKinsey applies directly to manufacturing is the WEF Global Lighthouse Network [2]. Starting from 16 factories in 2018, the network has expanded roughly tenfold to 153 factories by 2024, spanning more than 100 locations and industries from pharmaceuticals and steel to electronics and cosmetics. Lighthouse factories have achieved 20-50% gains in operational performance versus their peers, with average outcomes including +40% labor productivity, -48% lead time, and meaningful improvements in quality, energy efficiency, and emissions reduction.
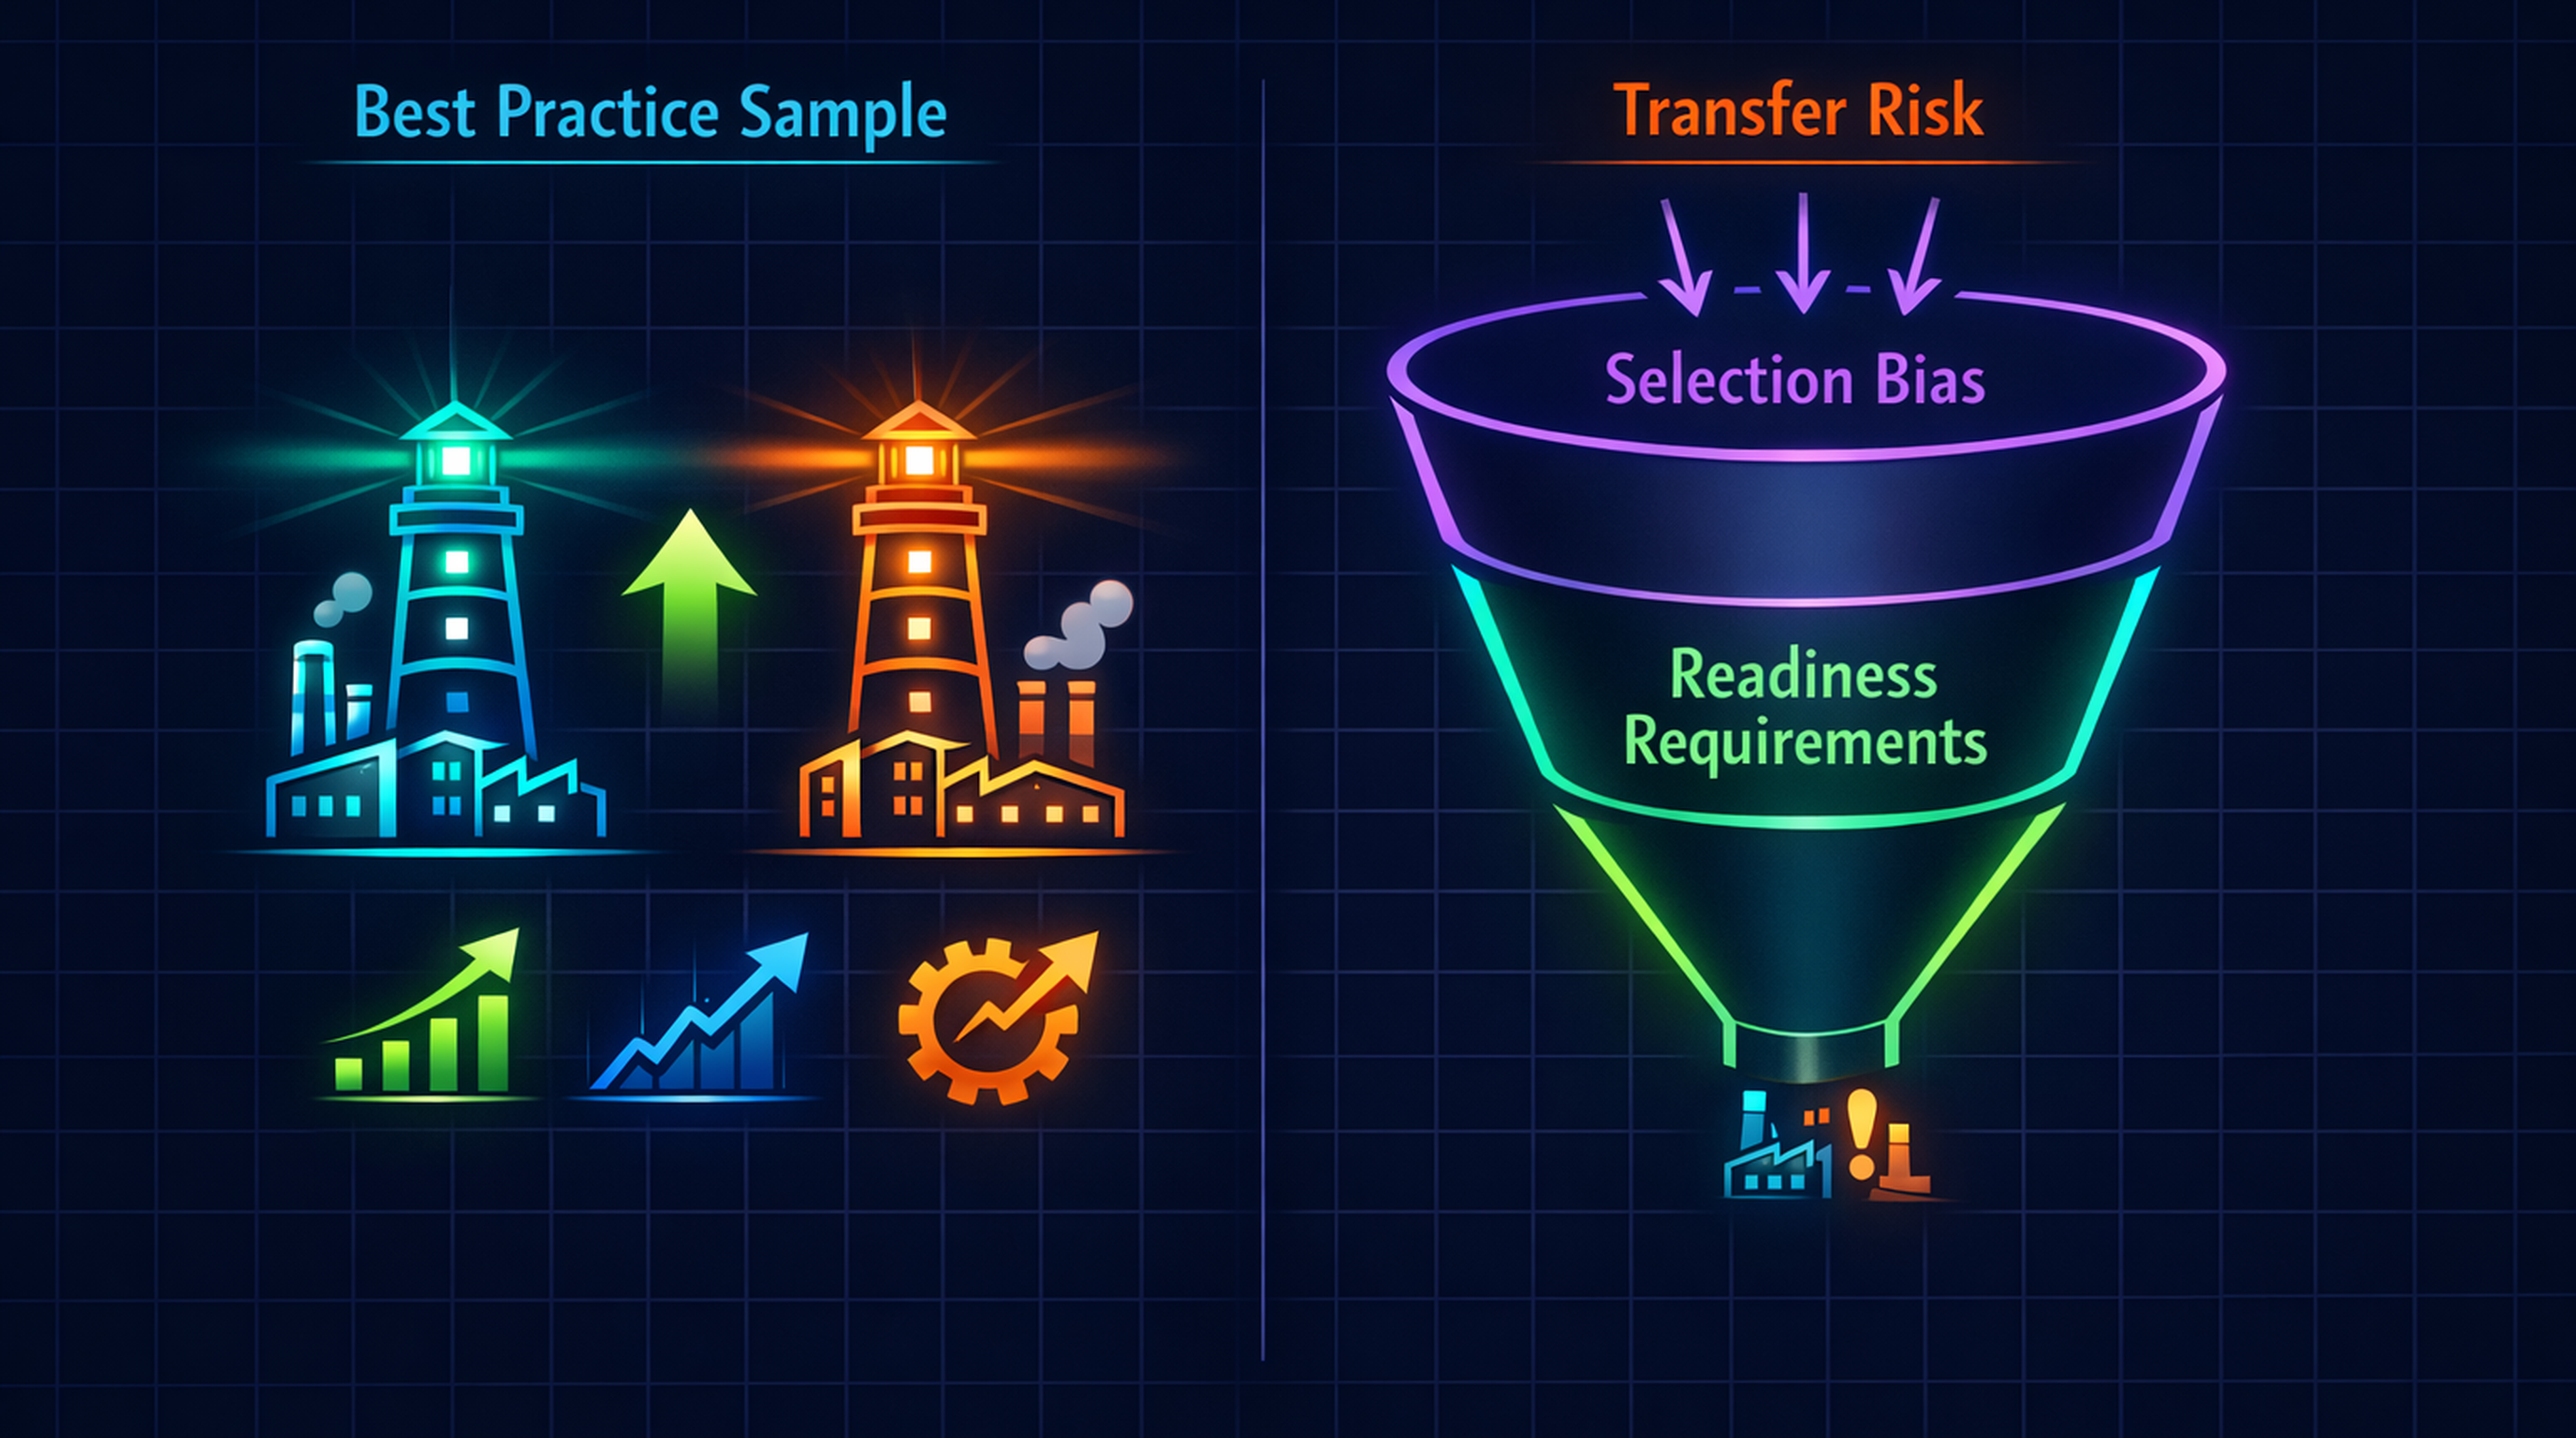
This dataset carries more weight than other consulting figures for two reasons. First, it is certification-based. Lighthouses are not self-reported; only factories that pass on-site inspection by WEF and McKinsey are included. Second, it cuts across industries and geographies — these are 153 independent cases, not a single-company case study.
The limits, however, are equally clear. Lighthouses are a best-practice sample, not the industry average. Even within the same company, other factories do not necessarily replicate this performance, and most lighthouses underwent 2-5 years of digital-transformation investment beforehand. It is realistic for COSMAX to aim for one or two of its plants to reach lighthouse status, but it is dangerous to assume all plants will enjoy an average +40% productivity gain.
State of AI 2025 — The Gap Between Adoption and Expectation
McKinsey QuantumBlack's State of AI report from November 2025 provides a more recent adoption snapshot [3]. 88% of organizations now use AI in at least one function (up from 78% in 2024), and GenAI usage more than doubled from 33% in 2024 to 72% in 2025. But the same report adds a decisive caveat — only about one-third of organizations have reached enterprise-wide scale.
The data on agentic AI shows an even larger gap. 62% are experimenting with agentic systems, but only 23% are scaling them somewhere, and most of that 23% sits in IT and customer support. Cases of autonomous agents operating on a manufacturing shop floor are rare enough that the report highlights them separately. Furthermore, 51% of organizations have experienced negative outcomes from GenAI deployment (inaccuracy and hallucination at 30% being the most common).
The signal a COSMAX executive should read from this data: (1) the surface adoption rate is rising rapidly, (2) but fewer than one-third of organizations have reached the scaling stage where actual value is realized, and (3) shop-floor autonomous agents are still frontier territory. This suggests that the more accurate question is not "are we late as a follower?" but "how do we end up in the one-third that scales successfully?"
4.3 BCG — The 70/20/10 Formula and ROI Reality
30% Productivity Gain — Under What Conditions
BCG's Executive Perspectives: Unlocking the Value of AI in Manufacturing, published in June 2025, argues that an end-to-end AI approach to industrial operations can deliver more than 30% productivity gains, citing as case evidence an end-to-end transformation that achieved +21% labor productivity [6]. The core message is summarized in three lines: (1) focus on the foundation, (2) the future of the factory is AI-enabled and largely autonomous, (3) AI frees humans but demands new skills.
But the most important caveat in the same report is the adoption-funnel data. 89% of manufacturers are planning AI adoption and 68% have already started, yet only 16% have actually achieved their AI goals [4]. Only that 16% is a candidate group for 30%-class productivity gains. In other words, BCG's headline number is "the average outcome of the successful 16%," not "the average across all companies that invested in AI."
Translated to COSMAX scale, this funnel reads as follows. Suppose COSMAX deploys Physical AI to five core lines. Applying BCG's data directly implies that roughly one of the five lines (20%) will reach a meaningful productivity gain. The remaining four will stall at PoC or deliver only partial effects. Recognizing this in advance and adopting a portfolio approach (one or two successful bets out of several is enough) is safer than going all-in on a single project.
70/20/10 — Not the Algorithm, but People and Process
BCG's most frequently cited framework is the 70/20/10 Rule [BCG, 2024 (10-20-70 framework)]. This is an empirical prescription for how to allocate effort in an AI transformation:
- 10% — selecting the right ML model and algorithm
- 20% — building high-quality data and technical infrastructure
- 70% — transforming new business processes and ways of working
The basis for this ratio is MIT Sloan Management Review's analysis that "70% of AI value depends on complementary investment in people and processes." That is also why BCG's 1,800-executive survey produces the 89-68-16% funnel — companies that invested in algorithms and data but did not put 70% of the effort into people, process, and organizational change remain outside the 16% that succeed.
The ratio is adjustable by company size and data maturity. BCG notes that "for mid-sized companies with severe data silos, a 50/40/10 mix (people/data/algorithm) may be more appropriate" [4]. For an organization like COSMAX — which already has MES, ERP, and LIMS in place to some degree but with plant-by-plant data standards that diverge — a 50/40/10 ratio is likely more appropriate, because data integration is the largest bottleneck.
PwC and Deloitte arrive at similar conclusions. PwC analyzes that "companies with high AI fit achieve a 7.2x AI-driven performance improvement" [10], and Deloitte stresses that "data foundation and workforce upskilling are prerequisites" [7]. The fact that three firms independently converge on the same conclusion suggests the 70/20/10 insight is more than BCG marketing.
Small-Scale Adoption vs. Large-Scale Transformation — The Shape of the ROI Curve
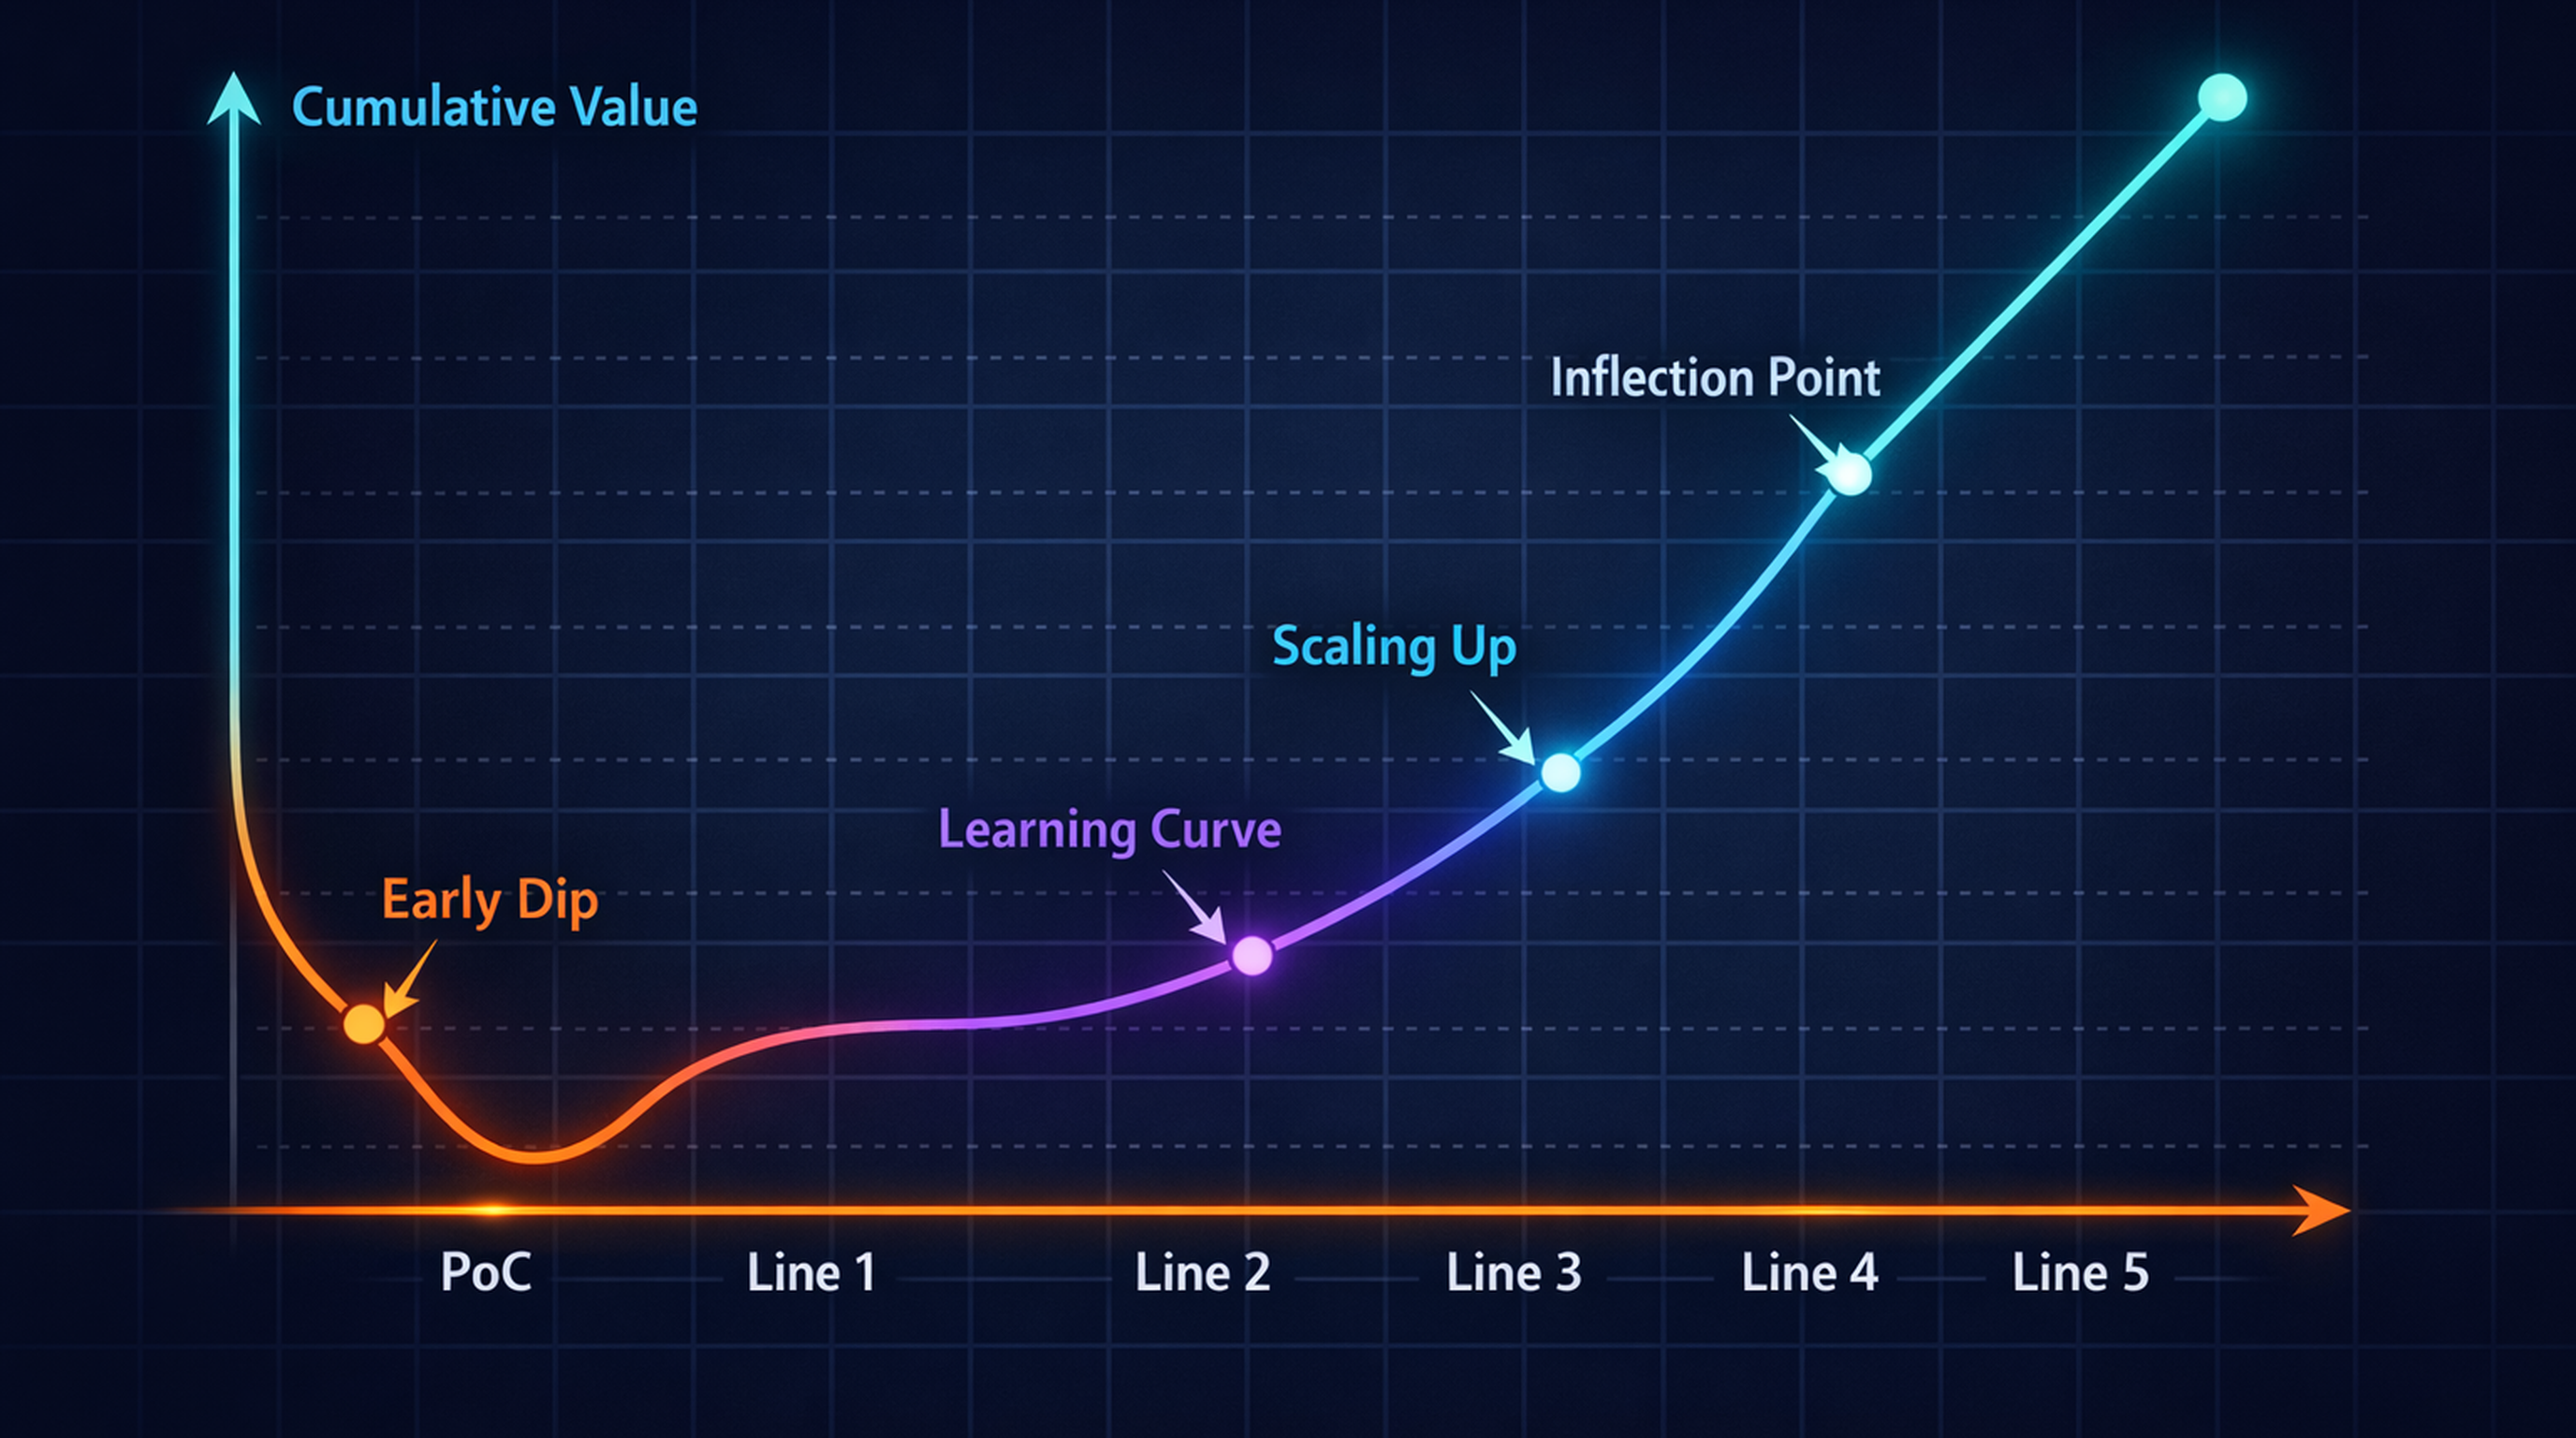
A common misconception needs to be addressed. The advice "start small with a PoC and scale once it's validated" is well-intentioned but obscures the fact that PoC-stage ROI is almost always negative. The essential purpose of a PoC is to validate fit across data, people, and process — not to recover cost.
BCG's analysis suggests that ROI typically becomes meaningful only when the same solution is deployed across three to five lines or more [6]. When an autonomous inspection system validated on one line is extended to ten lines, per-line deployment cost drops 50-70%, and operational stability rises through cross-line learning and standardization. The ROI curve takes a shape where the first line is loss-making, break-even arrives by the second, and profitability begins by the fifth.
The takeaway for COSMAX executives is clear. Do not set "first PoC payback" as a KPI. The first PoC is intentionally expensive and intentionally an investment for learning. Instead, setting "five-line standardization within three years" as the KPI lets the ROI curve naturally cross the threshold to positive.
4.4 Deloitte and PwC — Adoption Barriers and the Roadmap
92% Plan vs. the Implementation Gap
Deloitte's 2025 Smart Manufacturing and Operations Survey covers 600 manufacturing executives (fielded August-September 2024) [8]. 92% answered that smart manufacturing will be the core driver of competitiveness over the next three years (+6 percentage points versus 2019), and 80% plan to invest more than 20% of their improvement budget in smart manufacturing.
The investment-priority distribution is as follows: process automation as a top-2 priority for 46%, physical automation for 37%, and factory synchronization for 24%. By technology area, the ranking is data analytics (40%), cloud (29%), AI (29%), and IIoT (27%) [8]. What is interesting is that AI is essentially tied with data analytics in the top tier, but data analytics still receives the largest share of investment — a finding consistent with the data-quality-barrier evidence covered in the next section.
A different cut of the same Deloitte dataset is more concrete [9]. Manufacturers' technology budget itself rose from 8% of revenue in 2024 to 14% in 2025 and is expected to grow by approximately +6 percentage points annually thereafter. Of that, 21-50% (average 36%) of the digital-initiative budget is allocated to AI, and AI's share within the technology budget is forecast to rise from 8% to 13% over the next two years. AI infrastructure spending is expected to roughly triple by 2028.
Why 70% of Companies Cite Data Quality as the Top Barrier
The single most striking number in the same Deloitte survey is this: roughly 70% of manufacturers cited data-related issues (quality, contextualization, validation) as the largest obstacle to AI adoption [7]. Not algorithms, not talent, not budget, but data itself is the number-one barrier.
This 70% figure dovetails curiously with BCG's 70/20/10 formula. If BCG says "70% of effort must go to people and process," Deloitte answers "the data those people and processes work with is the largest barrier for 70% of companies." The two views are sides of the same coin — data quality is an output of people and process, not the sole responsibility of the IT department.
For a cosmetics ODM, this data is particularly heavy. COSMAX operates in a data environment characterized by:
- Thousands of SKUs and short batches, fragmenting per-line and per-product data
- A high share of manual work in filling and packaging, leaving stretches with insufficient digital trace
- R&D (LIMS) and production (MES) operated separately, breaking the formulation-to-production data chain
- Customer-specific quality standards, making it difficult to define unified quality KPIs
In this environment, attempting to drop-in NVIDIA Omniverse or BCG's 30% productivity claim will mean spending most of the first 6-12 months on data remediation. Acknowledging this up front in the budget and timeline is better than discovering it after a PoC fails for data reasons.
The joint analysis from PwC and Deloitte arrives at the same conclusion [7]. Both firms recognize the "people/process 70%, data 20%, algorithm 10%" effect distribution; both observe that lighthouses and early adopters maintain a 2-4x lead over peers; and both prescribe staged adoption (use case → process → enterprise) as the success path.
PwC — The Path to 50% Automation by 2030
PwC's February 2026 release Industrial Manufacturing's Race to 2030 offers the most aggressive long-range outlook [12]. It forecasts that the share of industrial manufacturers with highly automated core processes will more than double, from 18% in 2026 to 50% by 2030, based on a survey of 443 executives across 24 regions.
More striking is the predicted widening of the gap. Future-fit leaders will jump from 29% to 65% highly automated, while others will reach only 45%. By 2030, in other words, the automation gap between leaders and laggards will widen to 20 percentage points. Technology enablement is expected to grow 2.6x on average and automation 2.8x, and by 2030 44% of revenue is expected to come from outside core industrial and consumer goods — the scenario where manufacturers extend beyond product sales into services and platforms.
PwC's 2025 Global AI Jobs Barometer reinforces this with micro-level data [10]. Productivity growth among employees and industries with high AI exposure is 4x that of non-AI peers, and AI-skilled workers earn a 56% wage premium. The top tier of companies on AI fit achieves 7.2x AI-driven performance improvement (revenue increase combined with cost reduction). A subsidiary but important message: even in jobs susceptible to automation, employment continues to grow — AI is not replacing all jobs but creating new roles that operate AI.
PwC's outlook can be read in two ways. Optimistically: "There are four years until 2030, so starting now puts you in the leader group." Skeptically: "Consultancy four-year forecasts are always too aggressive, and the actual curve is likely to land at about half of PwC's predicted 50%." Either way, the direction is unambiguous — automation rates are rising, and the gap between leaders and laggards is widening.
4.5 The Truth Beyond the Numbers — Useful Questions for COSMAX
A More Important Question Than "When Will ROI Materialize?"
The consulting data assembled above naturally provokes two risky questions in a COSMAX executive's mind: (1) "When will ROI materialize for us?" (2) "How far have L'Oréal and P&G gone?" Both are meaningful, but more accurate questions exist.
A better first question: "Can we build one Lighthouse-certified factory within five years?" A Lighthouse is by definition a certified factory — WEF verifies it through on-site inspection. This question replaces "ROI," an abstraction that is hard to measure, with "Lighthouse certification," a clear external standard. Becoming a Lighthouse automatically clears the automation-KPI gates of global brand owners and brings quantitative indicators such as +40% labor productivity along internally [2]. ROI is the result, not the goal.
A better second question: "Are we willing to invest the first twelve months in data remediation?" Deloitte's 70% data-barrier figure, BCG's 70/20/10 formula, and PwC's 7.2x AI-fit gap — the three data points all point in the same direction. No Physical AI investment succeeds without a data foundation. The real question is whether COSMAX's leadership is willing to forgo visible results in the first twelve months and invest in data standardization, integration, and governance. If the answer is "no," it is better not to start the PoC at all — PoCs only operate on top of data.
A better third question: "Which line will we choose for the first bet?" BCG's ROI-curve data argues that "break-even requires expansion to five lines." That makes the choice of the first line critical. The conditions for a good first line are: (a) data is already relatively clean, (b) the work is repetitive and standardizable (e.g., filling, inspection), and (c) expandability — the solution from this line can immediately be transplanted to another four or five lines. Picking the most difficult line as the first PoC almost guarantees failure.
What Lighthouse Factories Have in Common
The meta-pattern observed across the 153 WEF/McKinsey Lighthouse factories is as follows [2]:
- Scale: an average of 1,000+ employees and $500M+ revenue per single factory. COSMAX's major plants (Pyeongtaek, Shanghai, Sangmyeong, Indonesia, USA) all fit this scale.
- Data maturity: MES and ERP are integrated, and per-line OEE (Overall Equipment Effectiveness) data is collected in real time as a starting point. A Lighthouse is not the beginning of digital transformation but its result.
- Leadership continuity: a single executive at the CEO or COO level remains in place for three to five years and drives the transformation. An organizational shield that does not yield to quarterly ROI pressure is essential.
- External partnerships: platform vendors like NVIDIA, Siemens, and Rockwell are leveraged in parallel with consultancies like McKinsey and BCG. Transformation through internal capability alone is nearly impossible.
- Workforce redeployment: workers whose roles shrink due to automation are not laid off but retrained for higher-value roles (data analytics, robot operations, quality engineering). This is a precondition for maintaining union and internal trust.
Of these five conditions, COSMAX immediately satisfies only the first (scale). Conditions 2-5 require deliberate investment. But this is no reason for pessimism — all 153 Lighthouses started from the same point five years ago.
A Realistic Starting Point at Cosmetics-ODM Scale
A four-year roadmap for a cosmetics ODM like COSMAX, grounded in the consulting data above, can be outlined as follows.
Year 1 (2026): Data Foundation
- Define unified standards for MES, ERP, LIMS, and QMS data
- Retrofit IoT sensors (real-time fill volume, weight, pressure, temperature) on one or two core lines
- Retrospectively clean existing SKU, batch, and quality data (at least 18 months of history)
- KPI: Achieve 70% data quality score (escape Deloitte's 70% data-barrier group)
Year 2 (2027): First PoC + Tier 1 Tooling
- Run an autonomous visual inspection PoC on one line (accept BCG's "first line is loss-making" reality)
- Build an NVIDIA Omniverse-based digital twin for one or two filling/packaging lines
- Co-define automation KPIs with one or two global brand customers
- KPI: PoC achieves 95% accuracy versus human inspection, with line uptime +5%
Year 3 (2028): Multi-Line Expansion
- Extend the validated solution to three to five lines (enter BCG's ROI-curve break-even)
- Connect operational data to formulation optimization (link with R&D automation)
- Select and concentrate investment on one Lighthouse-candidate factory
- KPI: Per-line labor productivity +15-20%, lead time -25%
Year 4 (2029): Lighthouse Application
- Apply for WEF Lighthouse certification (potentially the first global cosmetics-ODM candidate)
- Reach the top quartile on AI-fit grading (PwC criteria)
- Use automation ROI as leverage in negotiations with new global customers
- KPI: Labor productivity +30-40%, lead time -40%, two to three new global customers
This roadmap is intentionally more conservative than PwC's 2030 50%-automation outlook. Cosmetics ODMs face higher SKU diversity and a higher share of manual work than automotive or electronics manufacturers, so a 2-3 year lag versus the industry average is natural. But for the same reason, the differentiation opportunity is large — whichever cosmetics ODM becomes the first Lighthouse will likely enjoy a decisive advantage in winning global brand contracts for the next decade.
Finally, one sentence not to forget when reading consulting data: "Averages lie — both the average +40% productivity of Lighthouses and the average +5% productivity of non-Lighthouses are averages. Whether COSMAX ends up in which average is determined not by the consulting data but by the decisions of the next four years." From the next chapter (Chapter 5) onward, we look at industry-by-industry adoption cases that can inform those decisions — starting with pharmaceutical and chemical lab automation and moving through cosmetics, food, and apparel, the frontiers of ODM-adjacent industries.
Execution Lens — Translating Consulting Numbers Into Cosmax ROI
Consulting numbers are starting points, not final business-plan values. Cosmax should apply four correction factors to every automation use case: retrofit factor, SKU-changeover factor, hygiene/GMP factor, and data-maturity factor. Instead of applying a Lighthouse +40% productivity number directly to an existing Incheon line, the base case should discount it to 0.3-0.6x depending on new-build status and changeover frequency.
The first PoC KPI should be learning, not ROI. The right metrics are raw data capture rate, labeling cost, QA approval lead time, and whether rollback is possible without stopping the line. Only after these are known can economics be calculated for the second line.
References
- McKinsey Global Institute, 2023, The Economic Potential of Generative AI: The Next Productivity Frontier, McKinsey Report. https://www.mckinsey.com/capabilities/tech-and-ai/our-insights/the-economic-potential-of-generative-ai-the-next-productivity-frontier
- McKinsey & Company and World Economic Forum, 2024, The Continuing Evolution of the Global Lighthouse Network (153 Factories, 20-50% Productivity Gain), McKinsey/WEF. https://www.mckinsey.com/capabilities/operations/our-insights/the-continuing-evolution-of-the-global-lighthouse-network [McKinsey & WEF, 2024]
- McKinsey & Company QuantumBlack, 2025, The State of AI in 2025: Agents, Innovation, and Transformation (November 2025), McKinsey Global Survey. https://www.mckinsey.com/capabilities/quantumblack/our-insights/the-state-of-ai
- Boston Consulting Group, 2024, Shaking Up the Factory Floor with Digital and AI (1,800-executive global manufacturing survey; 89% planning, 68% started, 16% achieved AI goals), BCG Publication. https://www.bcg.com/publications/2024/shaking-up-the-factory-floor-with-digital-and-ai
- Boston Consulting Group, 2024, 5 Rules for Fixing AI and Machine Learning for Your Business — The 10/20/70 Rule for AI Transformation, BCG Article. https://www.bcg.com/publications/2022/5-rules-for-fixing-ai-and-machine-learning-for-your-business
- Boston Consulting Group, 2025, Executive Perspectives: Unlocking the Value of AI in Manufacturing (June 2025), BCG Executive Perspectives. https://www.bcg.com/assets/2025/executive-perspectives-unlocking-the-value-of-ai-in-manufacturing-30june.pdf
- Deloitte, 2025, Data Quality 70% Barrier to AI in Manufacturing, Deloitte / SupplyChainBrain. https://action.deloitte.com/insight/4246/manufacturing-orgs-get-real-about-ai-data-strategy [Deloitte, 2025a]
- Deloitte, 2025, 2025 Smart Manufacturing and Operations Survey (92% Investing, 600 Executives), Deloitte Insights. https://www.deloitte.com/us/en/insights/industry/manufacturing/2025-smart-manufacturing-survey.html [Deloitte, 2025b]
- Deloitte, 2025, AI in Manufacturing Insights — Tech Budget Allocation (Avg 36% to AI, 8%→14% Tech Budget Share, 3x AI Infra by 2028), Deloitte Insights. https://www.deloitte.com/us/en/insights/topics/digital-transformation/ai-tech-investment-roi.html [Deloitte, 2025c]
- PwC, 2025, 2025 Global AI Jobs Barometer (4x Productivity Growth, 56% Wage Premium, 7.2x Performance @ Top AI Fit), PwC Global AI Jobs Barometer. https://www.pwc.com/gx/en/issues/artificial-intelligence/job-barometer/2025/report.pdf [PwC, 2025a]
- PwC and Deloitte, 2025, Joint Manufacturing AI Implementation Insights — Cross-Reference Synthesis (70/20/10 alignment, 7.2x performance gap, staged adoption path), Multiple Reports. https://www.pwc.com/us/en/tech-effect/ai-analytics/ai-predictions.html
- PwC, 2026, Industrial Manufacturing's Race to 2030: 18% → 50% Highly Automated by 2030, PwC Global Industrial Manufacturing Sector Outlook (443 executives, 24 regions). https://www.pwc.com/gx/en/industries/industrial-manufacturing/industrial-manufacturing-race-2030.html